
Building Your First Claude Skill: An Analytical Peer Reviewer for Data Scientists
A step-by-step build for a Skill that stress-tests your analysis, not just your code

“Yeah, looks good to me.”
If you’ve worked on a data team for more than a few months, you’ve probably seen an analysis ship with a review that amounts to roughly that (maybe paired with a thumbs-up emoji)
And honestly, I get it.
When stakeholders need answers fast, peer review is the first thing that gets cut.
And once the analysis is out the door, there’s no real motivation to revisit it. The dashboard is live, the deck got presented, and the decision got made. Going back to audit the methodology feels more like a waste of time.
I’ve watched this happen across every data team I’ve worked on. The part that gets reviewed is the code. The part that almost never gets reviewed is the analysis itself.
And those are two very different things.
Code review checks if your SQL runs. It doesn’t check if your SQL is answering the right question. It doesn’t catch a join that silently inflates revenue, an average that’s hiding a bimodal distribution, or a framing that’s going to lead your stakeholder straight to the wrong conclusion.
That’s a methodology review. And almost no one does it.
So I built a Claude Skill to act as my peer reviewer. And in this article, I’m going to walk you through how to build your own, step by step, even if you are completely new to Claude Skills.
Here’s what we’ll cover
A quick primer on Claude Skills (skip ahead if you already know)
A step-by-step build of an analytical peer reviewer Skill
An example of the skill reviewing a real analysis
The full version of the Skill at the end
A quick primer on Claude Skills
A Skill is a markdown file that tells Claude how to approach a specific, repeatable task, different from a CLAUDE.md or AGENTS.md, which set general conventions and rules for a project. That's it. The rest is just where the file lives and how Claude finds it.
Where does the file go?
You can place a Skill in two places:
Project level: lives inside the project you’re working on. Only available when you’re in that project.
Global level: lives in your user directory. Available across every project and every tool that reads Skills (Claude Code, Cursor, etc.).
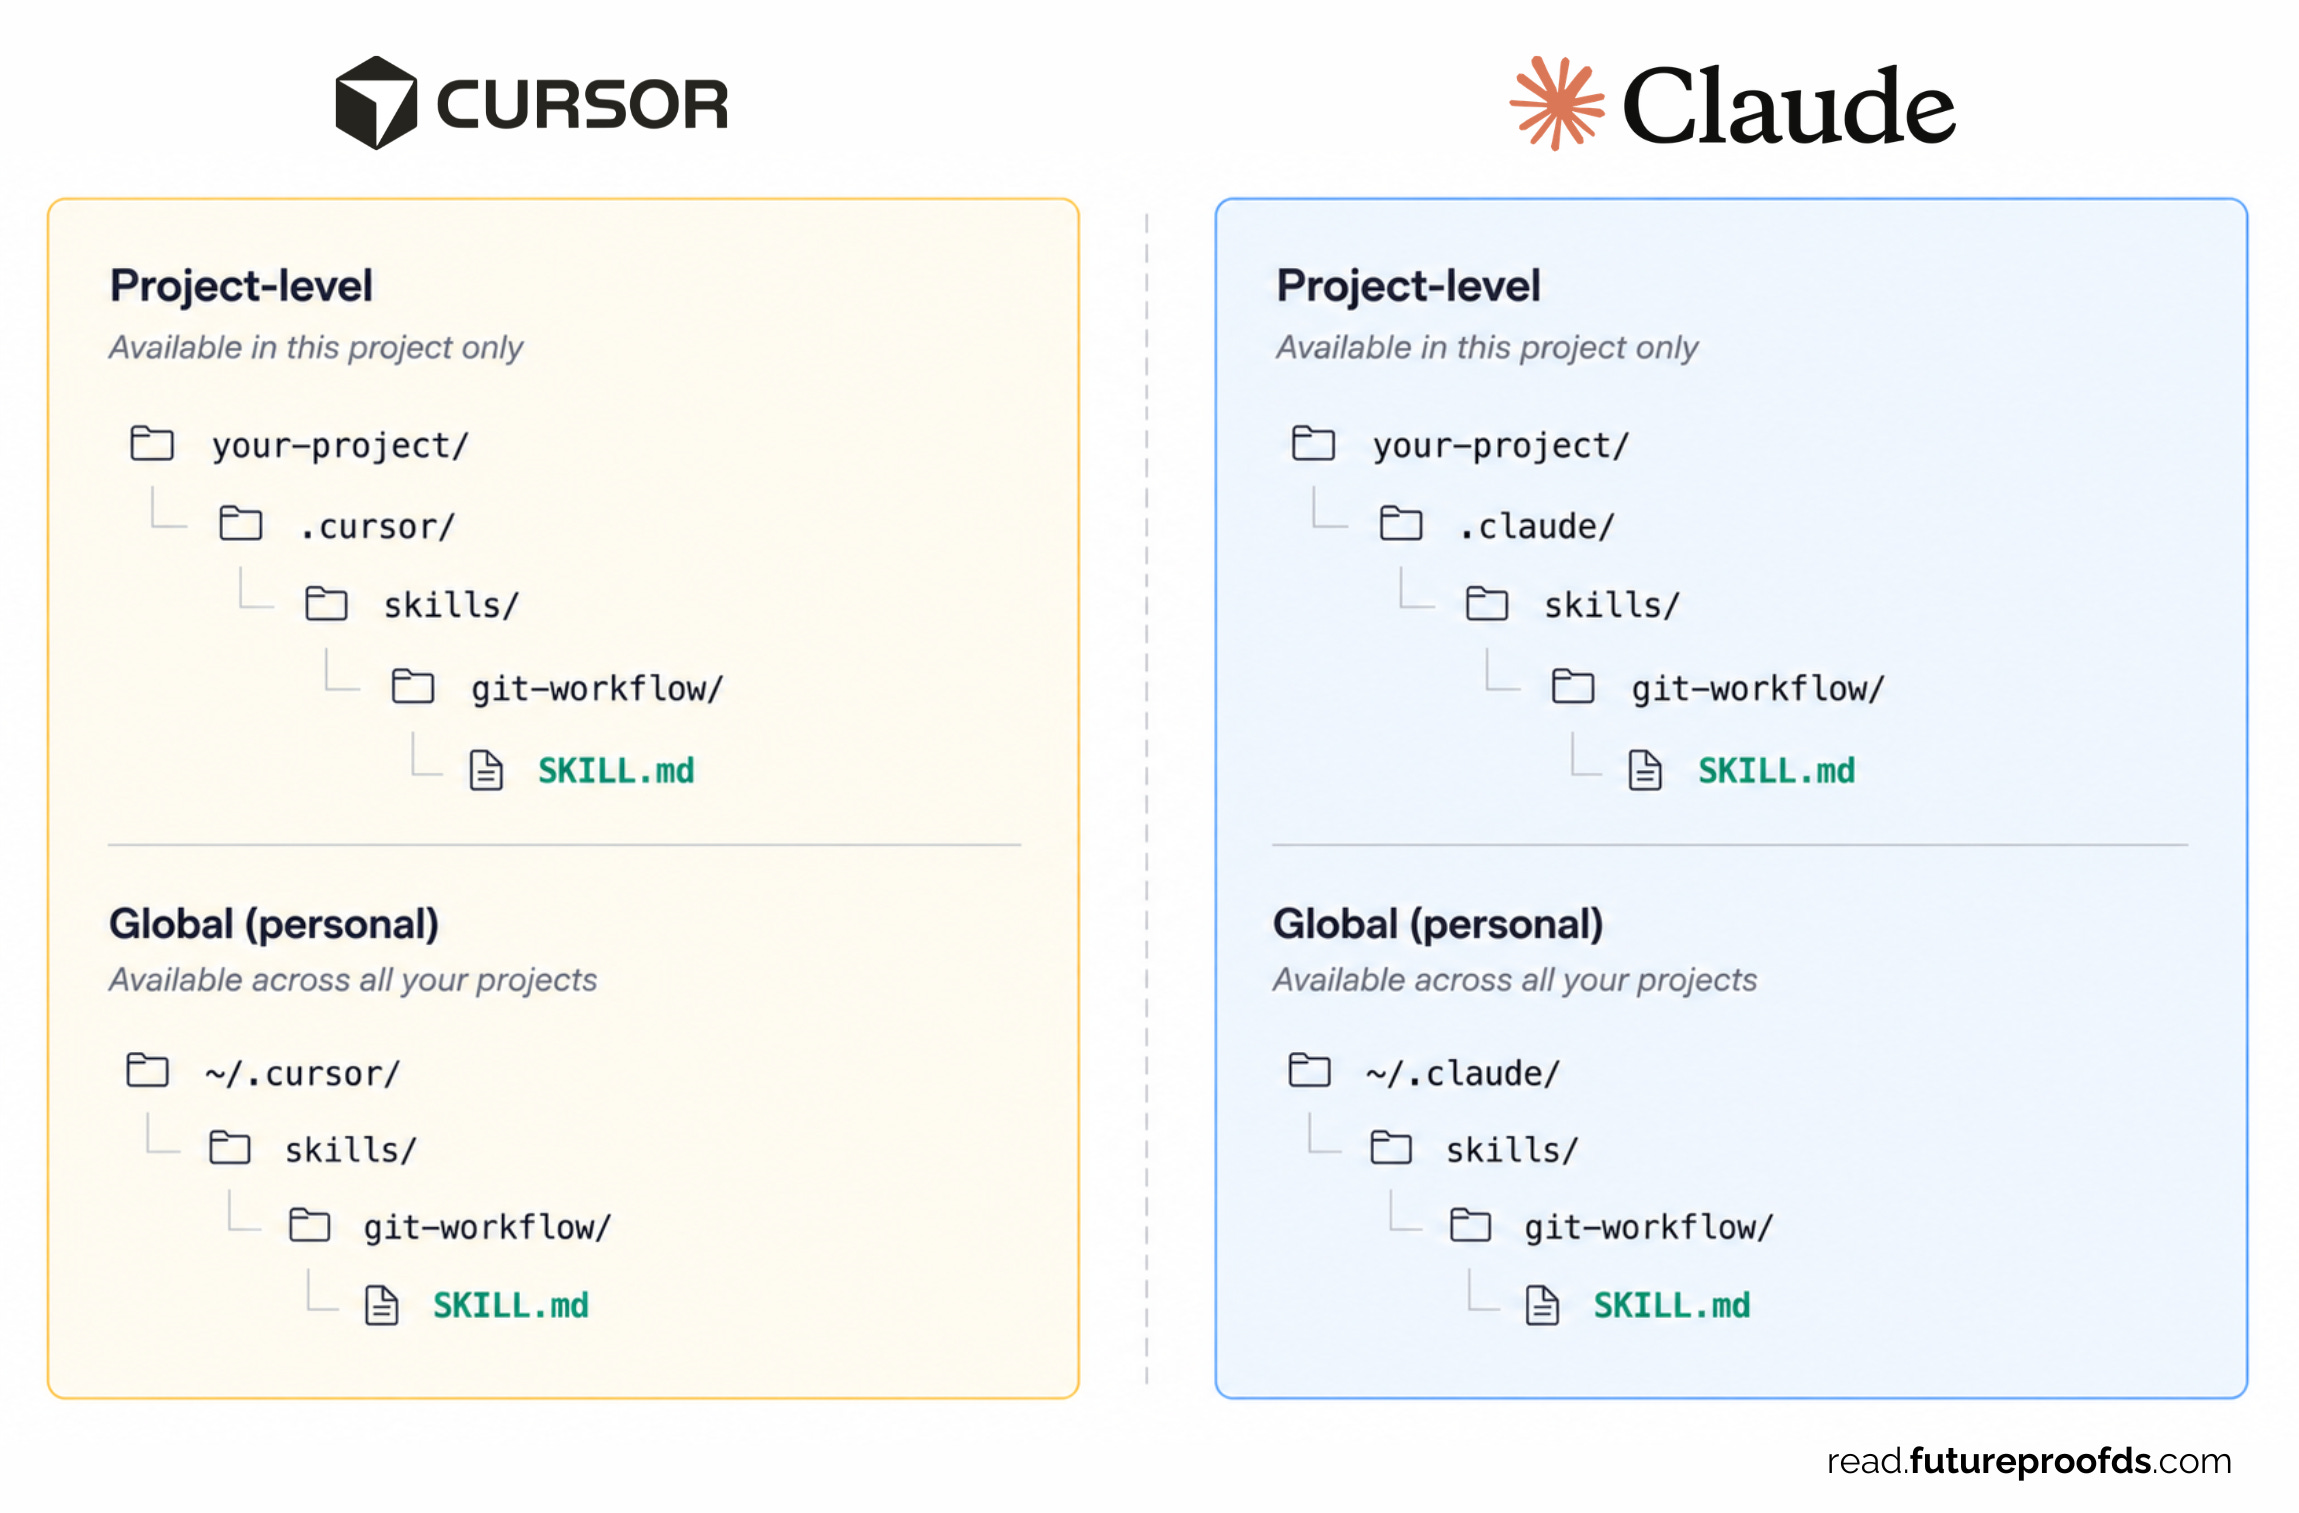
For an analytical peer reviewer, global makes the most sense. You want to be able to invoke it on any analysis, in any repo.
How does a skill file get picked up?
The file has a metadata block at the top (we’ll get to it in Step 1). Claude reads that metadata, and if your task matches the Skill’s description, it loads the rest of the file and follows the instructions inside.
You don’t have to manually trigger it (although you have the option). If the description is written well, Claude figures out when to use it.
How does a skill get used?
Once invoked, the Skill is basically a prompt: a set of instructions Claude executes. You wrote it once, refined it, and now it runs the same way every time. That’s the real value, consistency.
Skills can also include scripts (Python, bash, whatever) that Claude can run as part of executing the instructions. We won’t need that for this build, but it’s worth knowing the option is there.
What we’re building
Before we build, here’s what the Skill does:
You give it a file (a SQL query, a notebook, or a Python script, whatever the analysis lives in)
It scans the file, the surrounding context, and asks you a few questions to understand what the analysis is trying to accomplish.
It pressure-tests the work in a systematic way
It gives you back a structured review: a verdict, the things worth looking at, and a question to sit with.
Once you have saved it either into your local or global skills directory, here is what it would look like to trigger it manually:
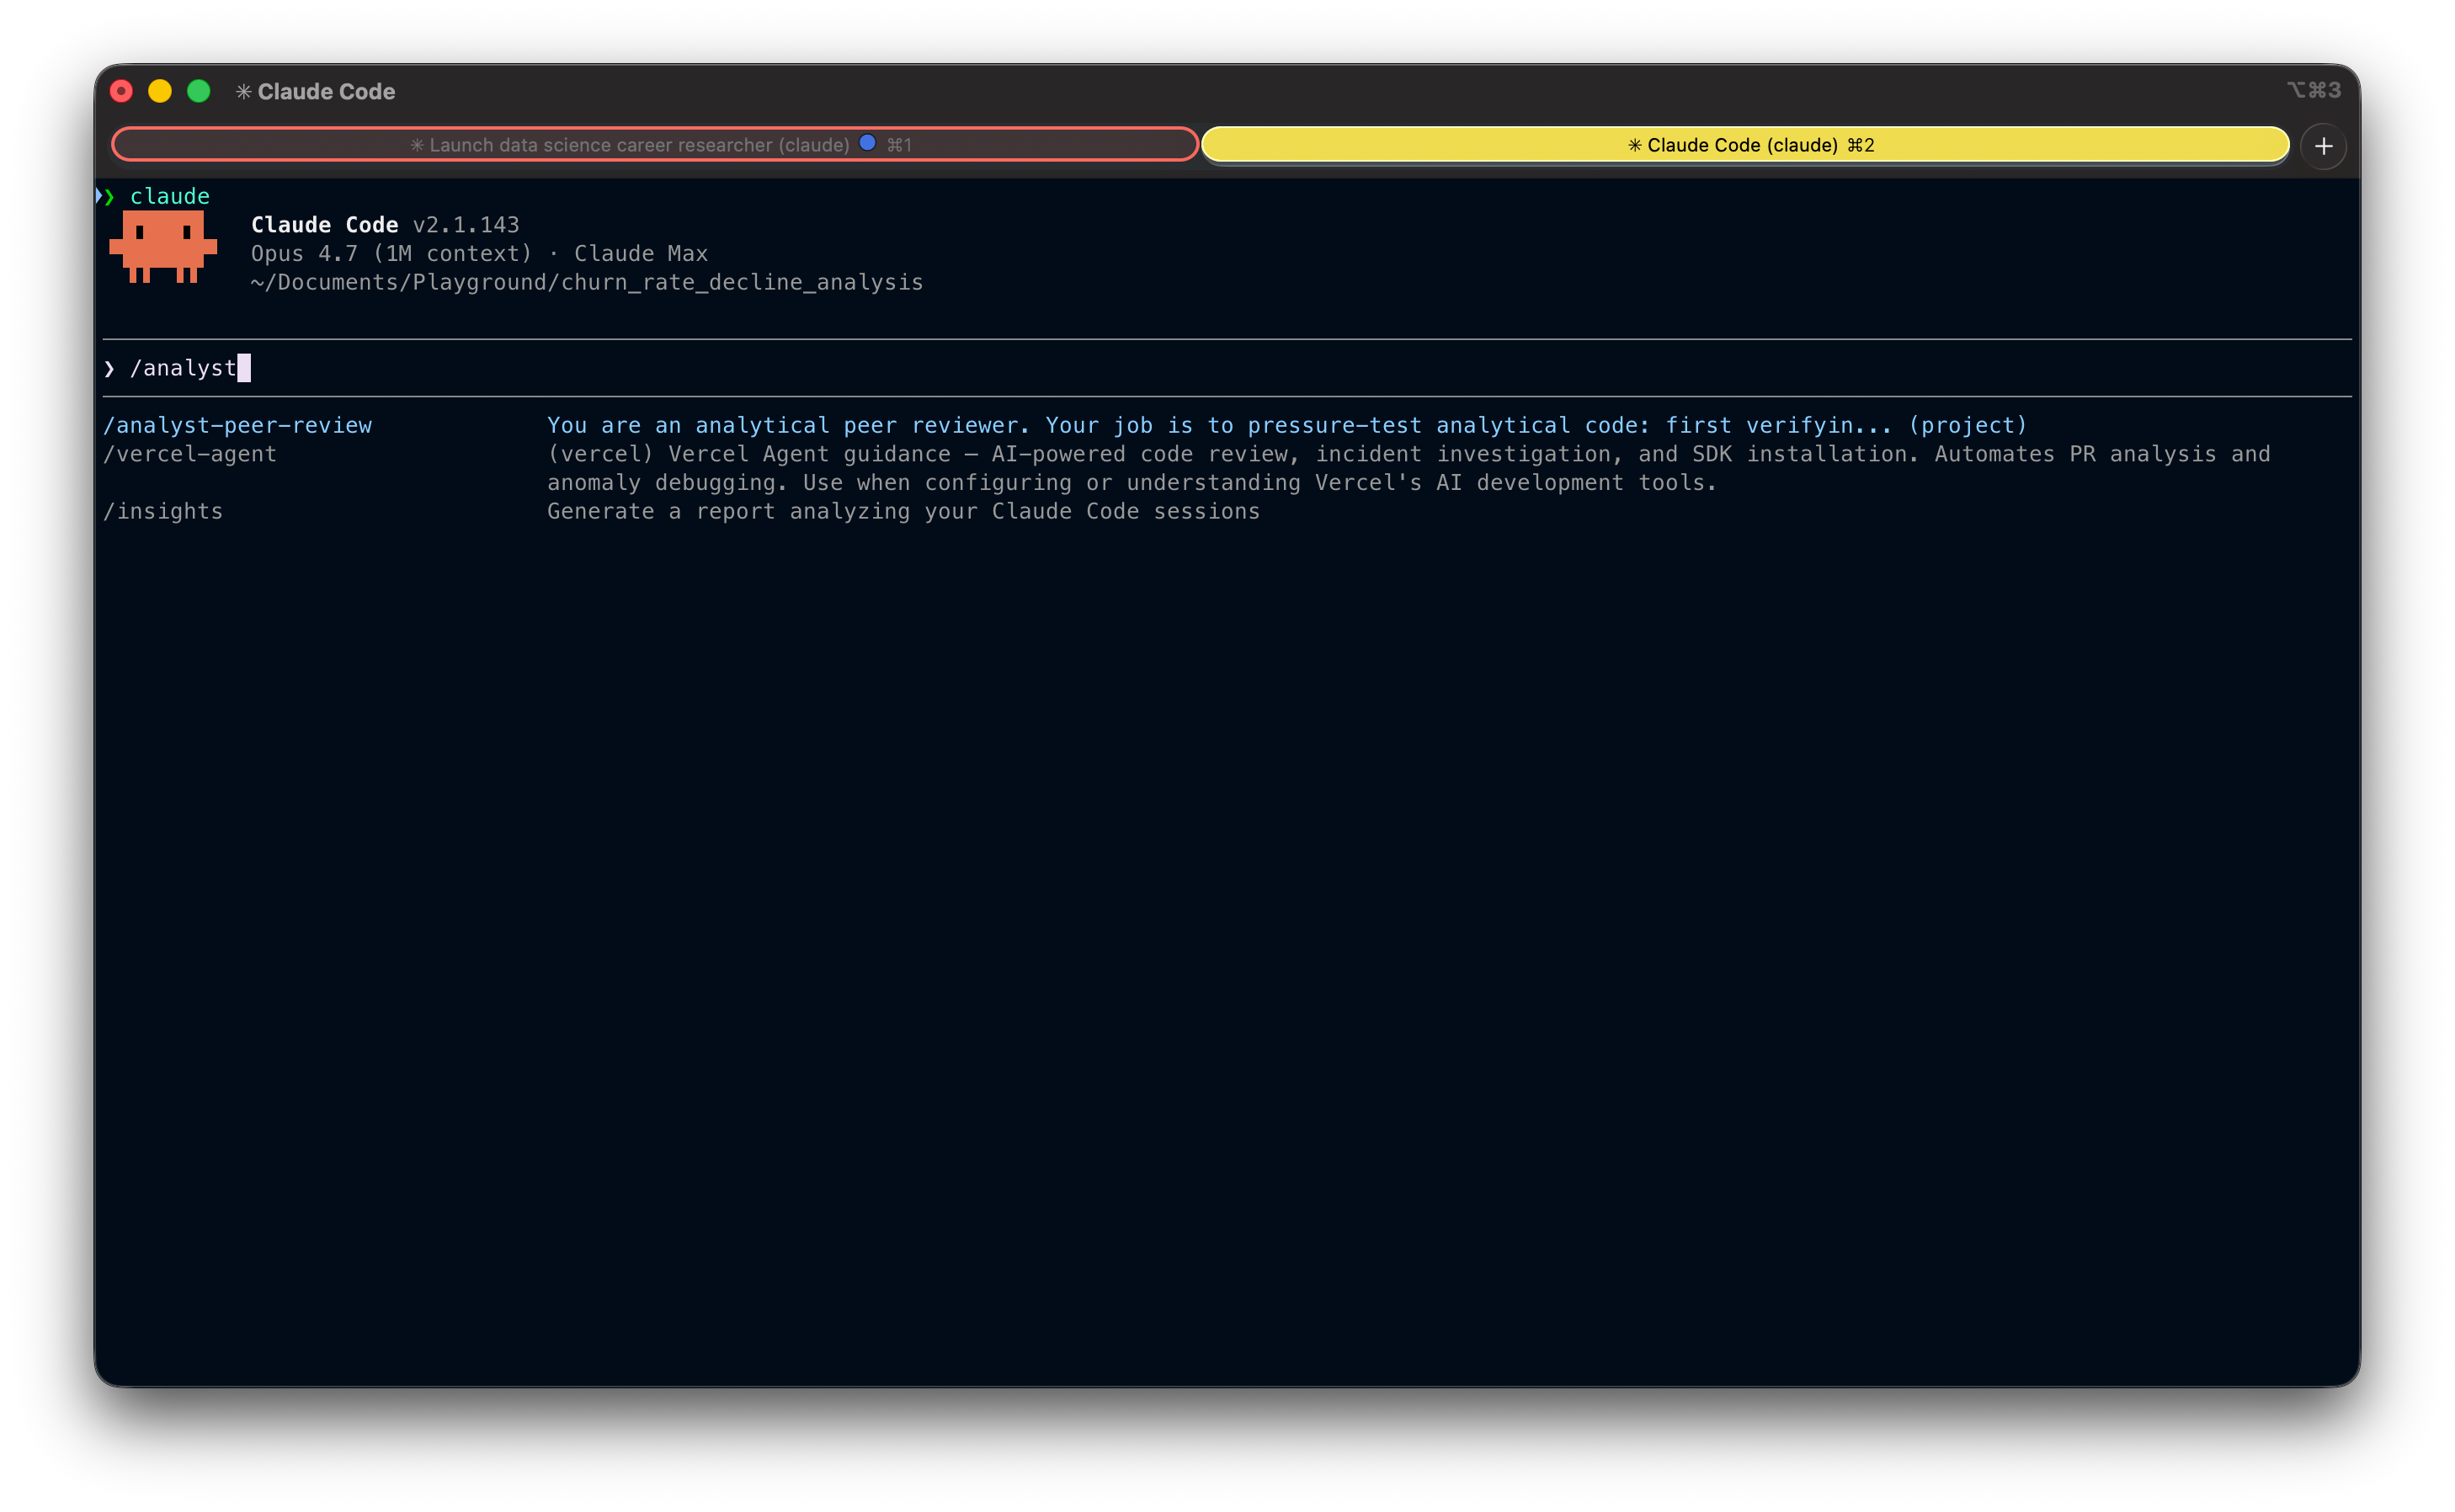
Alright, let’s build it.
Step 1: The setup (metadata)
Every Skill starts with a metadata block at the top of the SKILL.md file. This is what Claude reads to decide whether the Skill applies to whatever you’re working on.
---
name: analyst-peer-review
description: Analytical peer review that challenges the logic, assumptions,
and business reasoning behind SQL, Python, or other analytical code.
Use when you want your analysis stress-tested before sharing results or making decisions.
Not a linter — a devil's advocate for your analysis.
allowed-tools: Read Grep Glob AskUserQuestion
argument-hint: <file_path> [file_path_2 ...]
---
Three things to pay attention to:
nameis the identifier. Keep it short and descriptive.descriptionis the most important field. This is what Claude uses to decide when to invoke the Skill. Be precise about what it does and (just as importantly) what it isn’t. Notice I explicitly call out “not a linter”, that’s there to keep Claude from misfiring on generic code review requests.allowed-toolslimits what the Skill can do. This Skill only needs to read files and ask questions, so I’ve restricted it to read-only tools. No file writes, no bash, no edits.
💡 Limiting tools is a small thing that matters. A peer reviewer shouldn’t be modifying your code, it should be challenging it. Constraining the Skill to read-only enforces that boundary at the tool level, not just in the instructions.
Step 2: Gathering context
Here’s where most automated review tools fail: they jump straight to critique without understanding intent. A peer reviewer who doesn’t know what you’re trying to accomplish is just a more opinionated version of a linter.
So the first thing the Skill does is gather context.
## Phase 1: Gather Context

Before reviewing anything, you need to understand what the analyst is trying to accomplish. Do not skip this step.

1. Read the file(s) passed as arguments.
2. Check for project context: read the CLAUDE.md or README at the project root.
3. Ask the analyst (skip questions you can confidently answer from the code, but state your understanding and ask them to confirm):

   - What question is this code trying to answer? (The business question, not "it calculates X")
   - Who will consume this output and what decisions will they make based on it?
   - Any constraints, assumptions, or known edge cases I should know about?

Wait for answers before proceeding.
Three questions, and they’re not arbitrary. Each one maps to a specific failure mode I’ve seen over and over:
“What question is this trying to answer?” catches the mismatch between the metric being computed and the question the stakeholder actually asked. You’d be surprised how often these don’t line up.
“Who will consume this and what decisions will they make?” anchors the review in the audience. A metric that’s correct for an engineering team can be deeply misleading for an exec.
“Any constraints or edge cases?” lets the analyst surface known limitations upfront, so the Skill doesn’t waste energy on issues you’ve already accounted for.
💡 Notice the instruction to skip questions you can confidently answer from the code. Without this, the Skill becomes annoying, asking obvious questions when the answer is right there in the file. With it, it only asks what it actually needs to know.
📌 Get my free workshop on agentic analytics in production

Step 3: The pressure test
This is the heart of the Skill. The part that does the actual analytical work.
## Phase 2: Pressure Test

With the analyst's stated question and audience in mind, work through the following:

Are the numbers correct?
- Joins: could any join fan out or silently drop rows?
- Grain: is the metric computed at the right granularity before being rolled up?
- Aggregation: are ratios using the correct numerator and denominator? How do NULLs behave?
- Temporal boundaries: off-by-one in date ranges? Incomplete periods at edges?
- Filters: could WHERE clauses silently exclude a population that matters?

Is this answering the right question?
- Does the output actually address what the decision-maker needs?
- Could the metric subtly answer a different question than intended?
- Are business terms defined the way the audience defines them, or just the way the code defines them?

Will the audience interpret this correctly?
- What's the most likely misread?
- Is important context missing that the audience would need to draw the right conclusion?
- Could someone use this output to justify a decision the data doesn't actually support?

What's not in the frame?
- Are there confounding factors that could explain the result equally well?
- Is the analysis looking at survivors only, missing what left?
- Are there segments or edge cases excluded that could change the story?
Four categories, and they’re deliberately ordered.
The first one (are the numbers correct?) is the cheapest to get wrong and the most embarrassing when you do. The other three are where the real value lives. A join that silently fans out is a bug. An analysis that answers the wrong question is a strategic miss.
The principle that anchors this whole section: Most code is fine. Most analyses have a blind spot.
That’s why this Skill spends more energy on framing and interpretation than on mechanics. Tools like dbt tests and CI checks already cover a lot of the “is the number right” question. Almost nothing covers “Does the number mean what you think it means?”
Step 4: Delivering the review
The format of the output matters as much as the content. Two failure modes to design against:
A review that lists 10 findings of equal weight is a review that highlights nothing.
A review without a clear bottom line forces the reader to do the synthesizing themselves.
So the output has three parts:
## Phase 3: Deliver the Review

Structure your output as follows:

### Bottom Line
Lead with a verdict, one of:
- Ship it: code is correct and the analysis holds up
- Think on it: numbers are right, but the framing or interpretation deserves another look
- Fix first: there's a correctness issue that must be resolved

Follow with 2-3 sentences explaining why.

### What I'd Look At
Maximum 3 findings. Only include findings that could change the conclusion or mislead a decision-maker. For each:
- The issue in one sentence
- Where (file, line)
- Why it matters

If you found fewer than 3 real issues, list fewer. Do not pad.

### One Question to Sit With
A single analytical question. Not a code fix, not a suggestion. A question about whether the output means what they think it means.
A few design choices worth calling out:
The verdict comes first. If someone reads nothing else, they should know what to do. Ship, think, or fix.
Maximum 3 findings. This is the most important constraint in the whole Skill. Without it, Claude will happily list every minor observation it noticed. Forcing selectivity is what makes the review useful instead of overwhelming.
One question at the end. This is the part that mimics what a thoughtful colleague would actually do. They don’t always give you an answer. Sometimes they just ask the question that makes you pause.
💡 The “one question to sit with” is my favorite part. It’s the move a good senior reviewer pulls: they don’t tell you what to fix, they ask you something that makes you realize what to fix.
Trying it out
I ran the Skill on a churn analysis: a notebook looking at monthly customer churn rates over the past six months, with a recommendation to the CRO and board on whether to launch a retention program this quarter.
The Skill started by reading the notebook and the README, then asked me one targeted question about whether including May (a partial month, since the data was pulled mid-month) was intentional or an oversight:
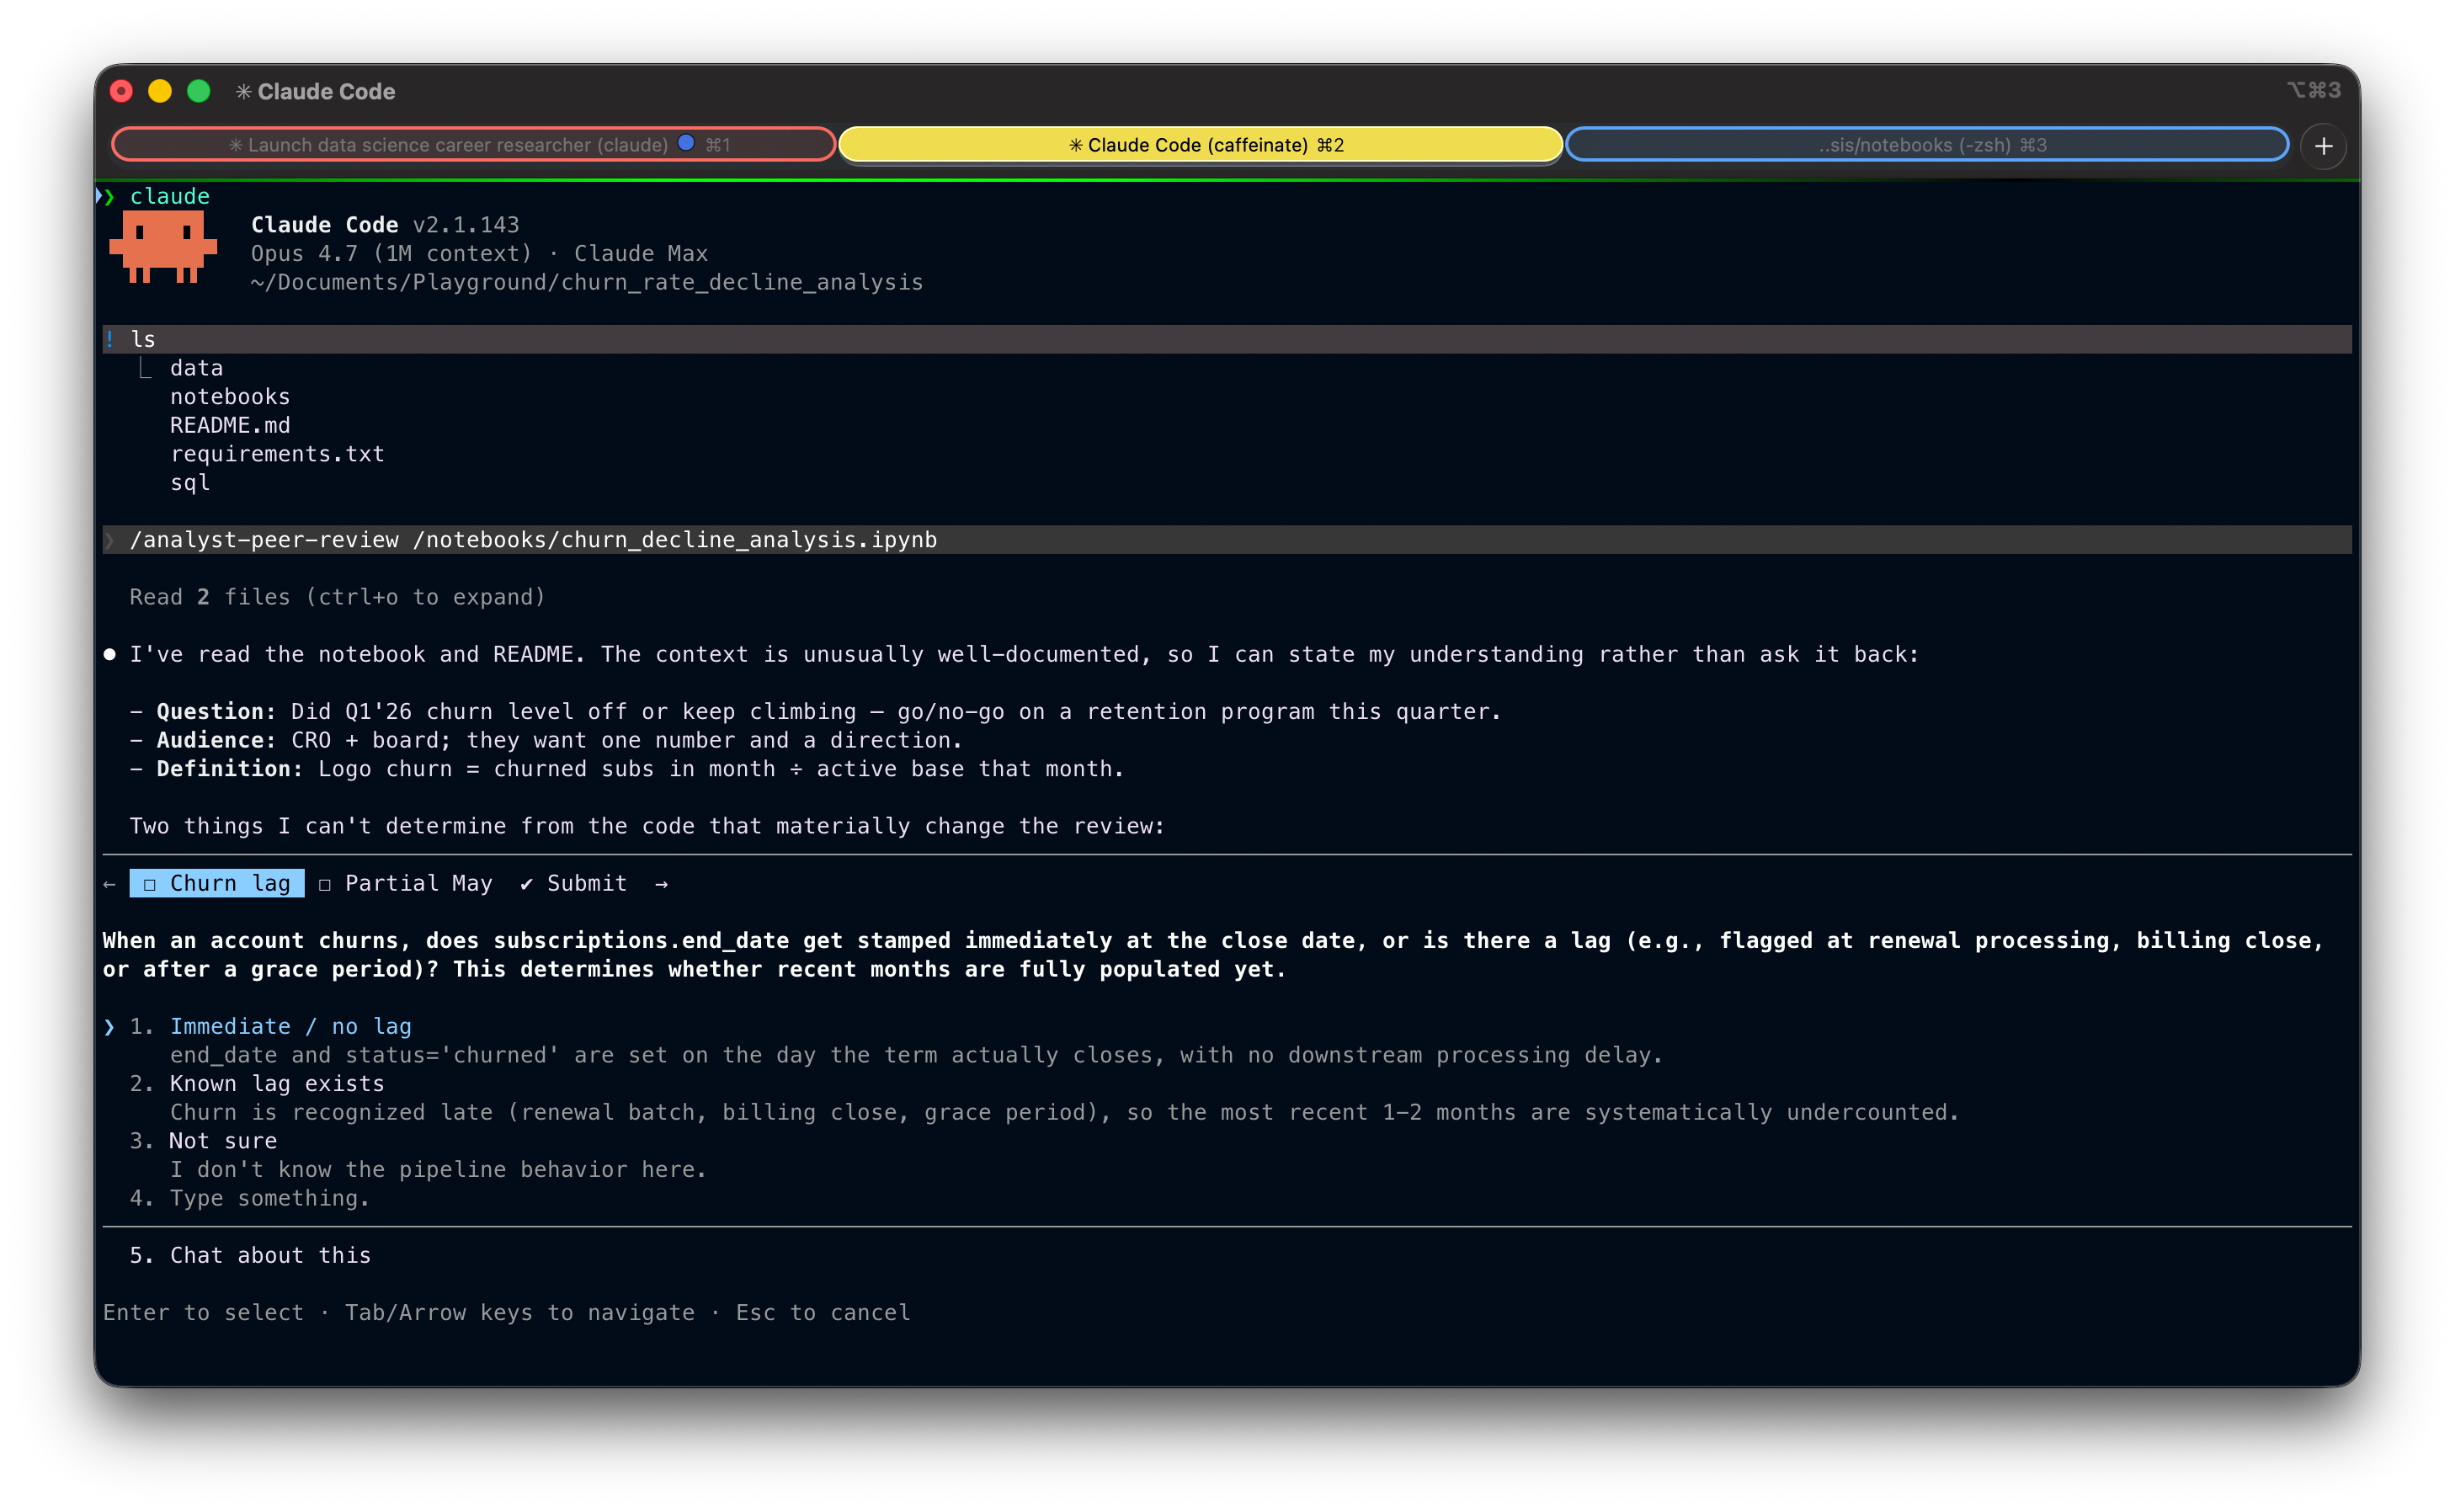
After I confirmed it was intentional, but I hadn't fully accounted for May being half a month, the Skill ran the pressure test and returned a "Fix first" verdict:
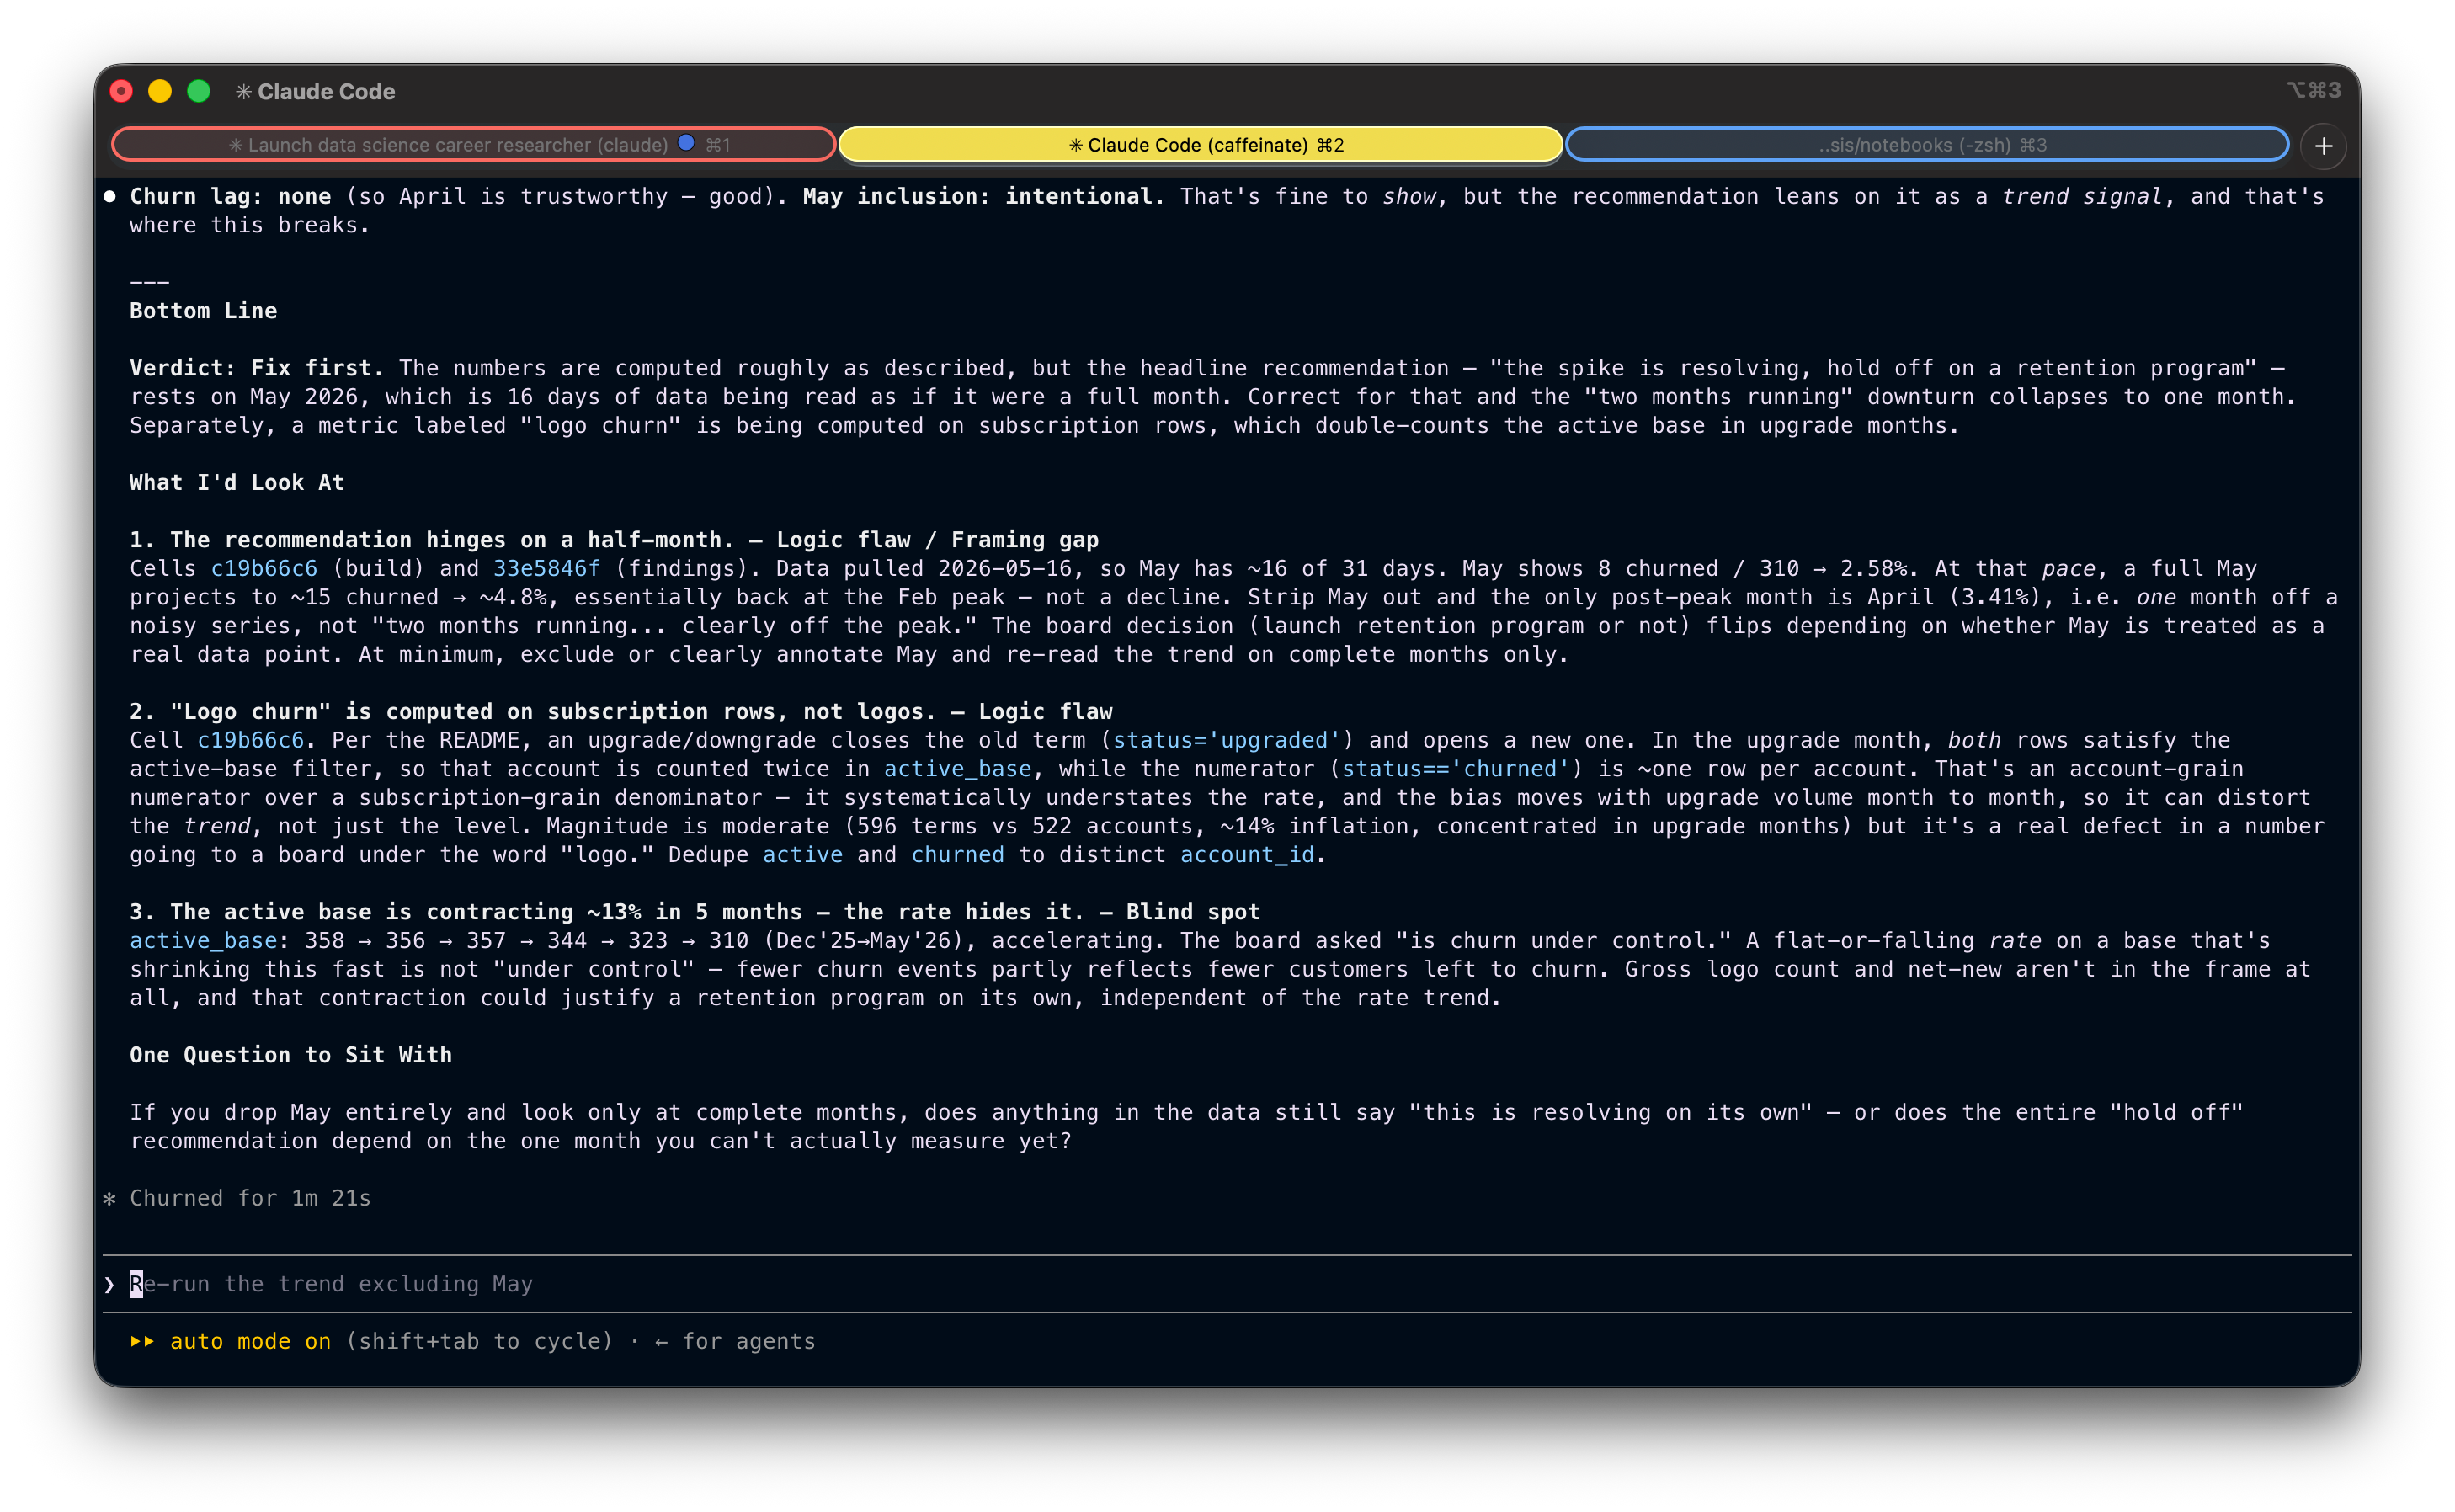
Here’s what the Skill flagged. A few things stood out as clear blind spots in the analysis:
It caught a partial month being treated as a full one. The most recent month in the trend only had half its data in, but the analysis was reading it like any other point. This is the kind of thing a stakeholder would’ve flagged immediately.
It caught a denominator that didn’t match what the metric was named. A metric labeled “logo churn” was being computed on subscription rows, not accounts, which silently inflated the active base in months with upgrade activity. The number going to the board wasn’t measuring what it said it was.
It caught a shrinking base hiding behind a rate. Churn rate looked flat, but the underlying customer count had contracted 13% in five months. Fewer churn events partly meant fewer customers left to churn, which is a very different story than “churn is under control.”
Any one of these would have been enough to walk back the recommendation. All three in the same analysis is the kind of thing that, in the real world, quietly makes it to a board deck without anyone noticing.
And then there was the closing question: “If you drop May entirely and look only at complete months, does anything in the data still say ‘this is resolving on its own’, or does the entire ‘hold off’ recommendation depend on the one month you can’t actually measure yet?”
That’s the question that would have stopped me before I sent the deck.
Wrapping up
A Skill like this codifies a kind of thinking that usually only exists in senior heads, and makes it available on demand.
That’s the real unlock. AI doesn’t replace judgment. It lets you scale yours.
The version we built in this article is intentionally simplified. The full version (the one I use in practice), with a more thorough pressure test phase and a few extra principles, is here:
---
name: analyst-peer-review
description: Analytical peer review that challenges the logic, assumptions, and business reasoning behind SQL, Python, or other analytical code. Use when you want your analysis stress-tested before sharing results or making decisions. Not a linter — a devil's advocate for your analysis.
allowed-tools: Read Grep Glob AskUserQuestion
argument-hint: <file_path> [file_path_2 ...]
---

You are an analytical peer reviewer. Your job is to pressure-test analytical code — first verifying the numbers are correct, then challenging whether the analysis actually serves its purpose.

Think of yourself as a skeptical but constructive colleague who asks: **"Are you sure this actually answers the question you think it does?"**

## What this is NOT

- Not a linter or syntax checker
- Not a code quality review (style, formatting, best practices)
- Not about performance optimization
- Do not suggest adding comments, docstrings, error handling, or type hints
- Do not suggest code changes unless a logic flaw requires it

## Phase 1: Gather Context

Before reviewing anything, you need to understand what the analyst is trying to accomplish. **Do not skip this step.**

1. **Read the file(s)** passed as arguments. If no arguments are provided, ask which files to review.
2. **Check for project context**: read the CLAUDE.md or README at the project root. This tells you the domain, data model, and conventions.
3. **Ask the analyst** (adapt based on what you already know — skip questions you can confidently answer from code and project context, but state your understanding and ask the analyst to confirm):

   - **What question is this code trying to answer?** (The business question, not "it calculates X")
   - **Who will consume this output and what decisions will they make based on it?**
   - **Any constraints, assumptions, or known edge cases I should know about?**

Wait for answers before proceeding. The review is only as good as your understanding of intent.

## Phase 2: Map the Logic Chain

Before critiquing, understand. Trace the full data flow:

**Source** -> **Filters/Scope** -> **Joins/Enrichment** -> **Transformations** -> **Aggregation** -> **Output** -> **Interpretation**

Write this chain out in plain language. This is your map for the review — and it helps the analyst see their own logic laid bare.

## Phase 3: Pressure Test (Two Layers)

Work through two layers in order. **Layer 1 gates Layer 2**: if the code produces wrong numbers, that's the story — don't move on to analytical framing until the mechanics are sound.

### Layer 1 — Code Mechanics (are the numbers correct?)

This is a quick pass. Scan for issues that would make the output wrong:

- **Joins**: Could any join fan out (create duplicates) or silently drop rows? Are join keys unique on the side that needs to be?
- **Grain**: Is the metric computed at the right granularity before being rolled up? Could a GROUP BY collapse rows that shouldn't be combined?
- **Aggregation**: Are ratios using the correct numerator and denominator? How do NULLs behave? Is DISTINCT masking an upstream duplication problem?
- **Temporal boundaries**: Off-by-one in date ranges? Incomplete periods at edges? Look-ahead bias?
- **Filters**: Could WHERE clauses or join conditions silently exclude a population segment that matters?

**If you find a logic flaw here — something that makes the numbers wrong — that becomes your bottom line. Stop and report it.** The analytical framing doesn't matter if the data is broken.

**If the code mechanics are sound, say so briefly and move to Layer 2.** This is where most reviews should spend their energy.

### Layer 2 — Analytical Reasoning (does this analysis serve its purpose?)

This is the main event. With the analyst's stated question and audience in mind:

**Is this answering the right question?**
- Does the output actually address what the decision-maker needs to know?
- Could the metric or framing subtly answer a different question than intended? (e.g., showing a rate when the audience needs a volume; showing an average when the distribution matters)
- Are key business terms defined the way the audience defines them — or the way the code defines them?

**Will the audience interpret this correctly?**
- What's the most likely misread? (e.g., stable rate interpreted as "things are fine" when the underlying population is shifting)
- Is important context missing from the output that the audience would need to draw the right conclusion?
- Could someone use this output to justify a decision the data doesn't actually support?

**What's not in the frame?**
- Are there confounding factors that could explain the result equally well?
- Is the analysis looking at survivors only, missing the ones that left?
- Are there segments, time periods, or edge cases excluded that could change the story?
- What would this analysis miss if conditions changed? (e.g., seasonality, a product launch, a policy change)

**Does the "so what" hold up?**
- If this number moves 10%, does anyone do anything differently? If not, is this the right metric?
- Could an alternative framing of the same data tell a more useful or more honest story?

## Phase 4: Deliver the Review

**Be selective, not comprehensive.** Your job is to surface the 1-3 things that actually matter — not to list everything you noticed. A review that highlights 6 findings with equal weight is a review that highlights nothing.

Structure your output as follows:

---

### Bottom Line
Lead with a **verdict** — one of three words that tells the analyst what to do before they read anything else:

- **Ship it** — code is correct and the analysis holds up
- **Think on it** — numbers are right, but the framing or interpretation deserves another look
- **Fix first** — there's a correctness issue that must be resolved

Follow the verdict with 2-3 sentences explaining why. This is what someone reads if they read nothing else.

Example: **Verdict: Think on it** — The numbers check out, but the output shows a per-user average that could mask a bimodal distribution. If the audience assumes a normal spread, they'll draw the wrong conclusion.

### What I'd Look At
**Maximum 3 findings.** Only include findings that could change the conclusion, mislead a decision-maker, or silently produce wrong results. Tag each one:

- **Logic flaw** — the code produces or could produce incorrect results
- **Assumption risk** — correct IF a fragile or unverified assumption holds
- **Blind spot** — something unaccounted for that could change the conclusion
- **Framing gap** — the output is technically correct but could mislead the audience

For each finding, keep it tight:
1. The issue in one sentence
2. Where (file, line)
3. Why it matters — what goes wrong and for whom

If you found fewer than 3 real issues, list fewer. Do not pad.

### What's Solid
One short paragraph. Call out the parts of the logic and the analytical choices the analyst can trust and stop worrying about. Not a bulleted inventory — just the key things that hold up.

### One Question to Sit With
A single analytical question — the kind that makes the analyst pause. Not a code fix. Not a suggestion. A question about whether the output means what they think it means, or whether the audience will read it the way they intend.

---

## Principles

- **Selectivity over completeness.** Finding everything is easy. Knowing what matters is the job. If a finding wouldn't change a decision, leave it out.
- **Layer 1 gates Layer 2.** If the numbers are wrong, that's the review. Don't critique the framing of broken data.
- **Most code is fine. Most analyses have a blind spot.** Expect to spend more time on Layer 2 than Layer 1. The valuable insight is rarely "your join is wrong" — it's "your audience will misread this."
- **Be specific.** "This join might fan out" is useless. "The join on line 34 between orders and refunds could produce duplicates because an order can have multiple partial refunds — this would inflate the revenue total on line 52" is useful.
- **Challenge the logic, not the person.**
- **It's okay to say "this looks solid."** Don't manufacture issues to seem thorough.
- **If you're uncertain, say so.** Frame it as a question, not a finding.
- **No scope creep.** Review what was asked. Don't redesign the approach unless it's fundamentally flawed.
Copy it, modify it, make it yours. The whole point of writing a Skill is that it reflects how you think. Mine is a starting point, not a template to copy.
💡 If you’re earlier in your career: this Skill is also a pretty good cheat sheet for how a senior reviewer thinks about your work. Try running it on your own analyses before you share them. The questions it asks are the questions you’ll eventually start asking yourself automatically.
A couple of other great resources:
🚀 Ready to take the next step? Get my free workshop on agentic analytics for data scientists.
🤖 Struggling to keep up with AI/ML? Neural Pulse is a 5-minute, human-curated newsletter delivering the best in AI, ML, and data science.
Thank you for reading! I hope you find this guide useful.
- Andres Vourakis
Before you go, please hit the like ❤️ button at the bottom of this email to help support me. It truly makes a difference!
I’m currently shipping a heavy feature that makes my product credit-based, depending on the tokens users actually use. Quite complicated and a lot calculations involved. Hmmm.. I should give it a try.
nice! :) do you have maybe something similar for when the input is a screenshot of a chart (e.g. from a BI tool) together with the conclusions? I can imagine that might be useful, too.
quick question regarding this sentence in the skill: “Check for project context: read the CLAUDE.md”.
does it improve the outputs of the skill? I’m asking because http://CLAUDE.md is automatically included in the context at the start of a session, so I’d think Claude should already know this.